Background
Sustainability reporting in India traces its roots to global developments in corporate accountability, particularly the UN Guiding Principles on Business and Human Rights, which India endorsed in 2011. The groundwork, however, had already been laid in 2009, when the Ministry of Corporate Affairs introduced its first voluntary guidelines on corporate social responsibility. These guidelines set the philosophical foundation for everything that followed: the idea that businesses owe more than financial returns to their stakeholders.
This thinking eventually matured into the National Guidelines on Responsible Business Conduct (NGRBC), whose nine principles form the backbone of the BRSR framework today. Together, they span ethical conduct, product lifecycle sustainability, employee wellbeing, stakeholder engagement, human rights, environmental protection, responsible public policy advocacy, inclusive growth, and consumer value.
BRSR organizes disclosures into three sections. Section A covers general disclosures about the company. Section B covers management and process disclosures, essentially how the company governs and approaches its responsibilities. Section C, the core of the report, covers principle-wise performance disclosures, where companies report actual data against each of the nine NGRBC principles. This section is further split into two categories of indicators: essential indicators, which are mandatory, and leadership indicators, which are voluntary and meant to showcase more advanced sustainability practices.
Evolution of BRSR — A Timeline
| Year | Development |
|---|---|
| 2009 | Ministry of Corporate Affairs (MCA) introduces its first voluntary CSR guidelines, framing early guidance on social, environmental, and economic responsibility. |
| 2011 | India endorses the UN Guiding Principles on Business and Human Rights. MCA formalizes this into the National Voluntary Guidelines (NVGs), purely educational at this stage. |
| 2012 | SEBI mandates the Business Responsibility Report (BRR) for the top 100 listed companies. First binding disclosure requirement, though narrow and largely qualitative. |
| 2019 | MCA replaces the NVGs with the National Guidelines on Responsible Business Conduct (NGRBC), which sharpened the principles and aligned them more closely with the UN Sustainable Development Goals. |
| 2021 | SEBI introduces BRSR, replacing BRR and expanding the mandate to the top 1,000 listed companies. Reporting becomes compulsory from FY 2022–23, built on the nine NGRBC principles. |
| 2023 | SEBI introduces BRSR Core, a stricter subset of around 49 KPIs. This required third-party assurance, starting with the top 150 companies and structured on a glide path that eventually extends to the full top 1,000 by FY 2026–27. The same circular also introduced ESG disclosures across the value chain. |
| 2024–2025 | SEBI eases transition rules based on expert committee feedback. Value chain disclosures and prior-year comparatives are made voluntary for the first reporting cycle. |
Project Overview
This project analyzes the quality of BRSR disclosures across Nifty 50 companies. The output is a heatmap visualizing which companies and sectors are genuinely transparent versus those providing vague or missing data.
Research Question
Does ESG disclosure among Nifty 50 companies under the BRSR framework reflect genuine substantive reporting, or does it largely constitute formal compliance without corresponding depth?
Selected Key Performance Indicators
The study examines eleven KPIs distributed across the Environmental, Social, and Governance dimensions of the BRSR framework.
| Environmental Indicators | Social Indicators | Governance Indicators |
|---|---|---|
| 1. Water discharge by destination and level of treatment - P6 Q4 (Essential + core parameter) | 4. Number of days of accounts payable (Accounts payable*365)/cost of goods/services procured - P1 Q8 (Essential + core parameter) | 8. Details of Social Impact Assessment (SIA) of projects undertaken by the entity - P8 Q1 (Essential) |
| 2. Waste management by the entity - P6 Q4 (Essential + core parameter) | 5. Details of safety related incidents - P3 Q11 (Essential + core parameter) | 9. Information on rehabilitation and resettlement undertaken by the entity - P8 Q2 (Essential) |
| 3. Total Scope 3 emissions and their intensity - P6 Q2 (Leadership) | 6. Training on human rights issues and policies of the entity - P5 Q1 (Essential) | 10. Job creation in smaller towns - P8 Q5 (Essential + core parameter) |
| 7. Gross wages paid to females as % of total wages paid by the entity - P5 Q3b (Essential + core parameter) | 11. Information relating to data breaches - P9 Q7 (Essential + core parameter) |
KPI Selection Criteria
Three criteria informed the selection of the eleven KPIs examined in this study.
First, regulatory mandate: all Essential indicators are statutorily required under the BRSR framework, as per SEBI’s circular of May 2021, effective from FY 2022–23 for the top 1,000 listed companies by market capitalization.
Second, overlap with BRSR Core: seven of the eleven selected KPIs fall within BRSR Core, as defined under SEBI’s 2023 circular, and are therefore subject to mandatory third-party assurance for the top 150 listed companies.
Third, inclusion of a Leadership indicator: one KPI was deliberately selected from the voluntary Leadership category. It serves as a useful marker of a company’s compliance posture.
Scoring Methodology
Each company is scored 0 to 1 per KPI:
- 1 means authentic disclosure — the company provides the exact quantitative data requested by the BRSR format for the entire reporting entity
- 0 means evasion — the company evades the requirement. Evasion can take different forms: data is missing entirely, use of narrative text instead of a hard number, claim of ‘Not Applicable’ to bypass the metric, or manipulation of the data (e.g. footnote states a changed formula or restricted reporting boundary)
In the context of the SIA and Rehabilitation and Resettlement indicators, IT, finance, and service entities are scored 1 if they report “N/A” or “NIL.” Heavy industry and manufacturing entities are scored 0 if they leave the field blank or use unexplained dashes, but scored 1 if they provide a written note with a clear explanation.
Data Source
Annual reports for FY 2023–24 of Nifty 50 companies, sourced from BSE/NSE filings. The BRSR section of each report was reviewed directly.
Company × KPI Disclosure Matrix — Nifty 50
Figure 1 — Company-by-KPI grid showing where disclosures look authentic (teal) versus evasive or manipulated (orange) across all 50 companies and 11 KPIs. Governance indicators like Social Impact Assessment and Rehab & Resettlement show frequent flags, while companies like Coal India, Adani Ports, and Wipro stand out with the most flags overall, pinpointing the exact company-KPI combinations driving disclosure concerns.
Sector-wise Disclosure Rates — Nifty 50
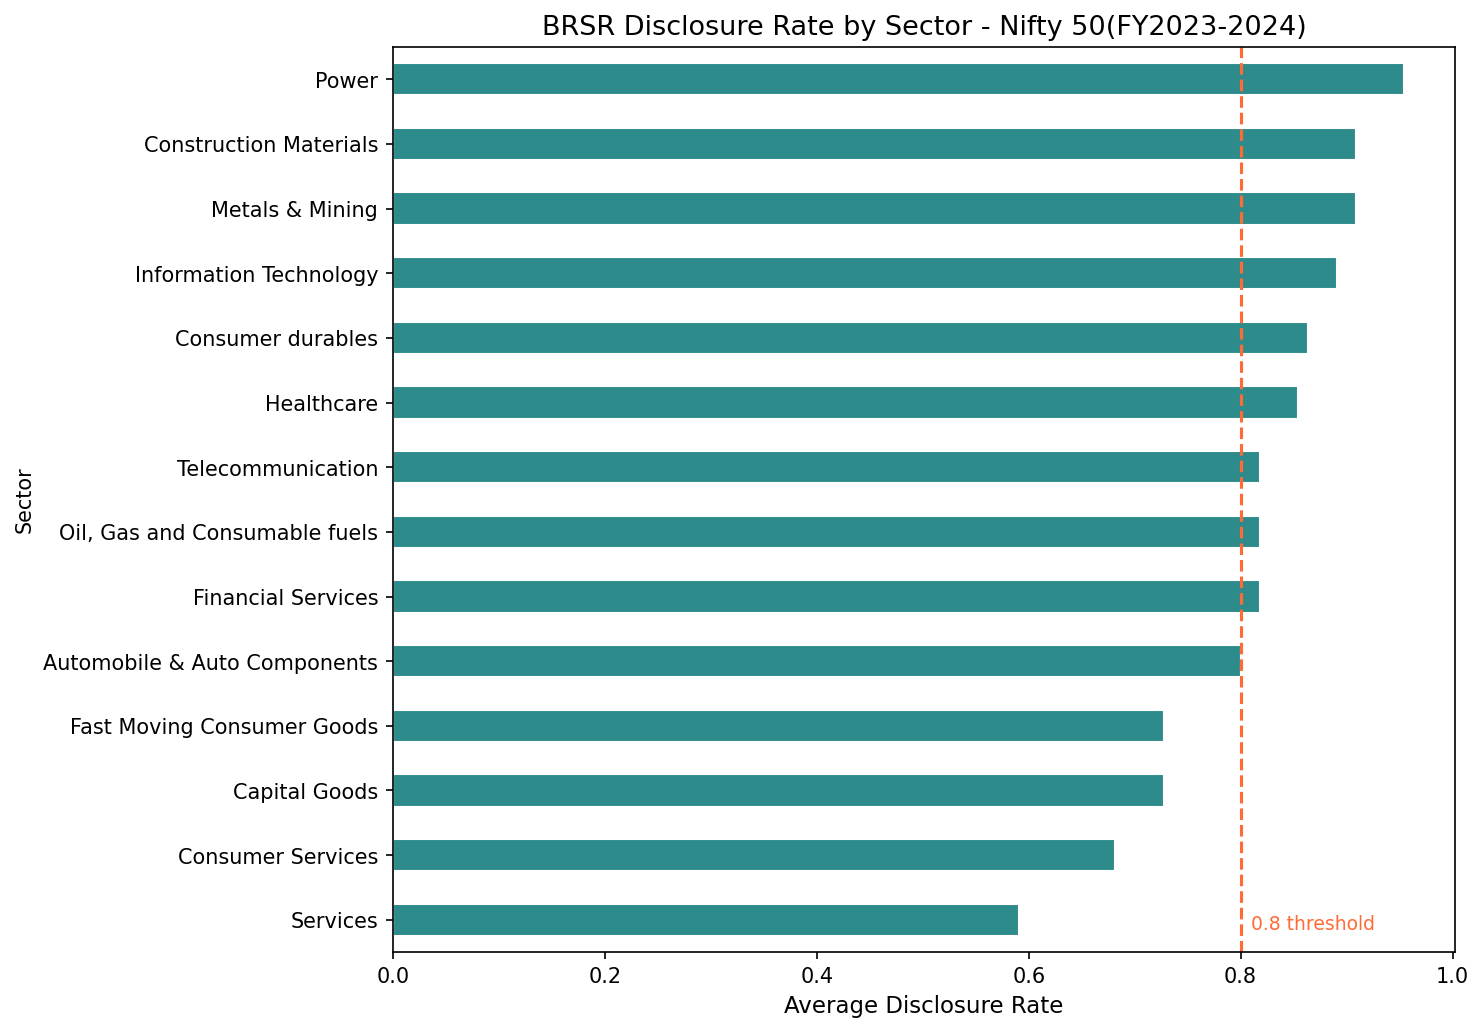
Figure 2 — BRSR Disclosure Rate by Sector — bar chart ranking Nifty 50 sectors by average disclosure rate across 11 KPIs, against
a 0.8 threshold. Power, Construction Materials, and Metals & Mining score highest (0.9+), while Services, Consumer Services, and
Capital Goods fall below the threshold (0.6–0.7), indicating weaker sector-wide disclosure quality.
E vs S vs G Disclosure Rate by Sector — Nifty 50
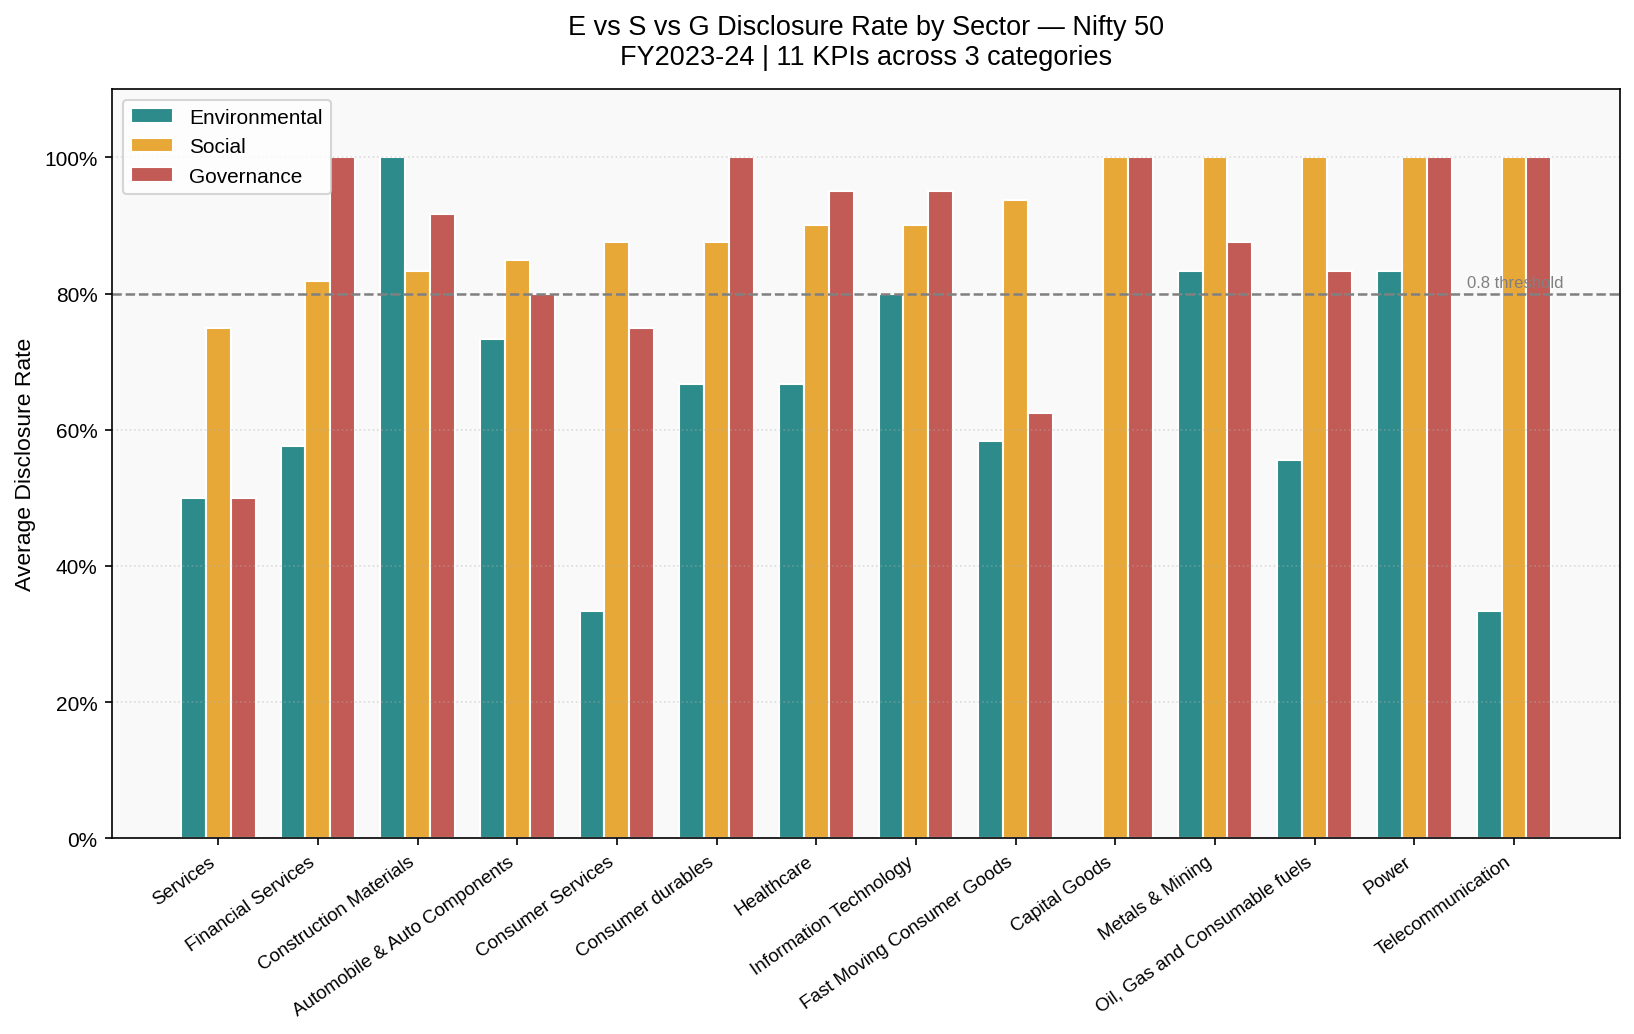
Figure 3 — E vs S vs G Disclosure Rate by Sector — grouped bar chart comparing disclosure rates across Environmental, Social, and Governance categories for each sector. Social and Governance scores stay consistently high (80–100%) across most sectors, while Environmental disclosure lags noticeably in Telecommunication, Consumer Durables, and Oil & Gas, pointing to environmental reporting as the weakest pillar overall.
Disclosure Rate per KPI — Nifty 50
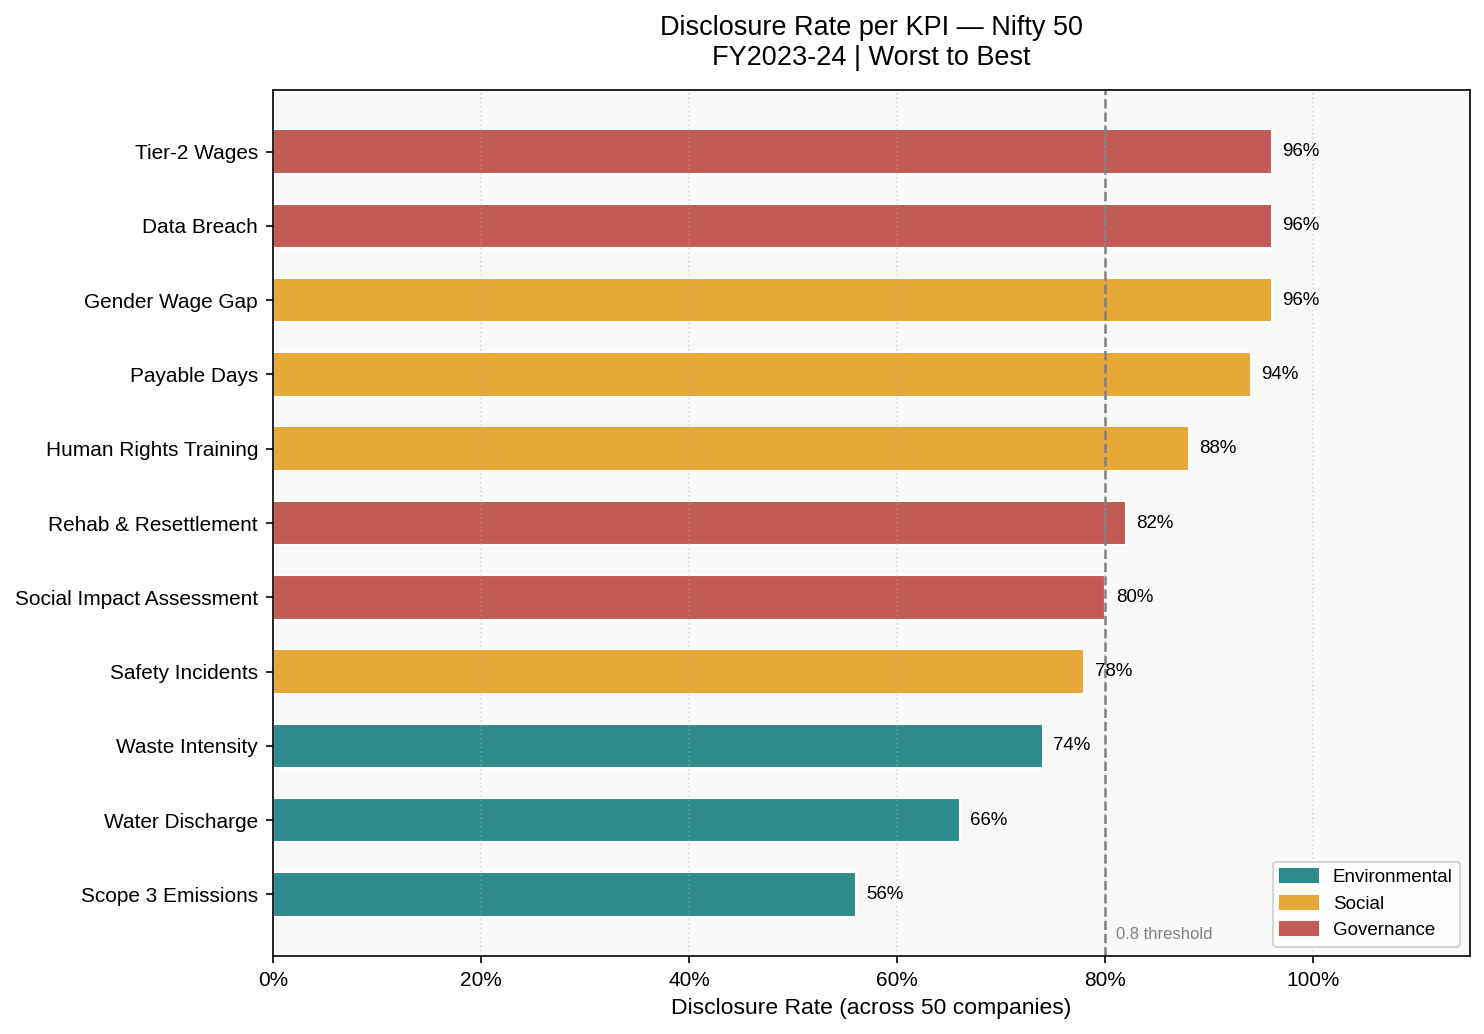
Figure 4 — Disclosure Rate per KPI — bar chart ranking all 11 KPIs from worst to best by disclosure rate across the 50 companies. Tier-2 Wages, Data Breach, and Gender Wage Gap lead at 96%, while Scope 3 Emissions (56%), Water Discharge (66%), and Waste Intensity (74%) trail behind, identifying Scope 3 emissions as the single weakest disclosure metric.
BRSR Disclosure Score — Nifty 50 Companies
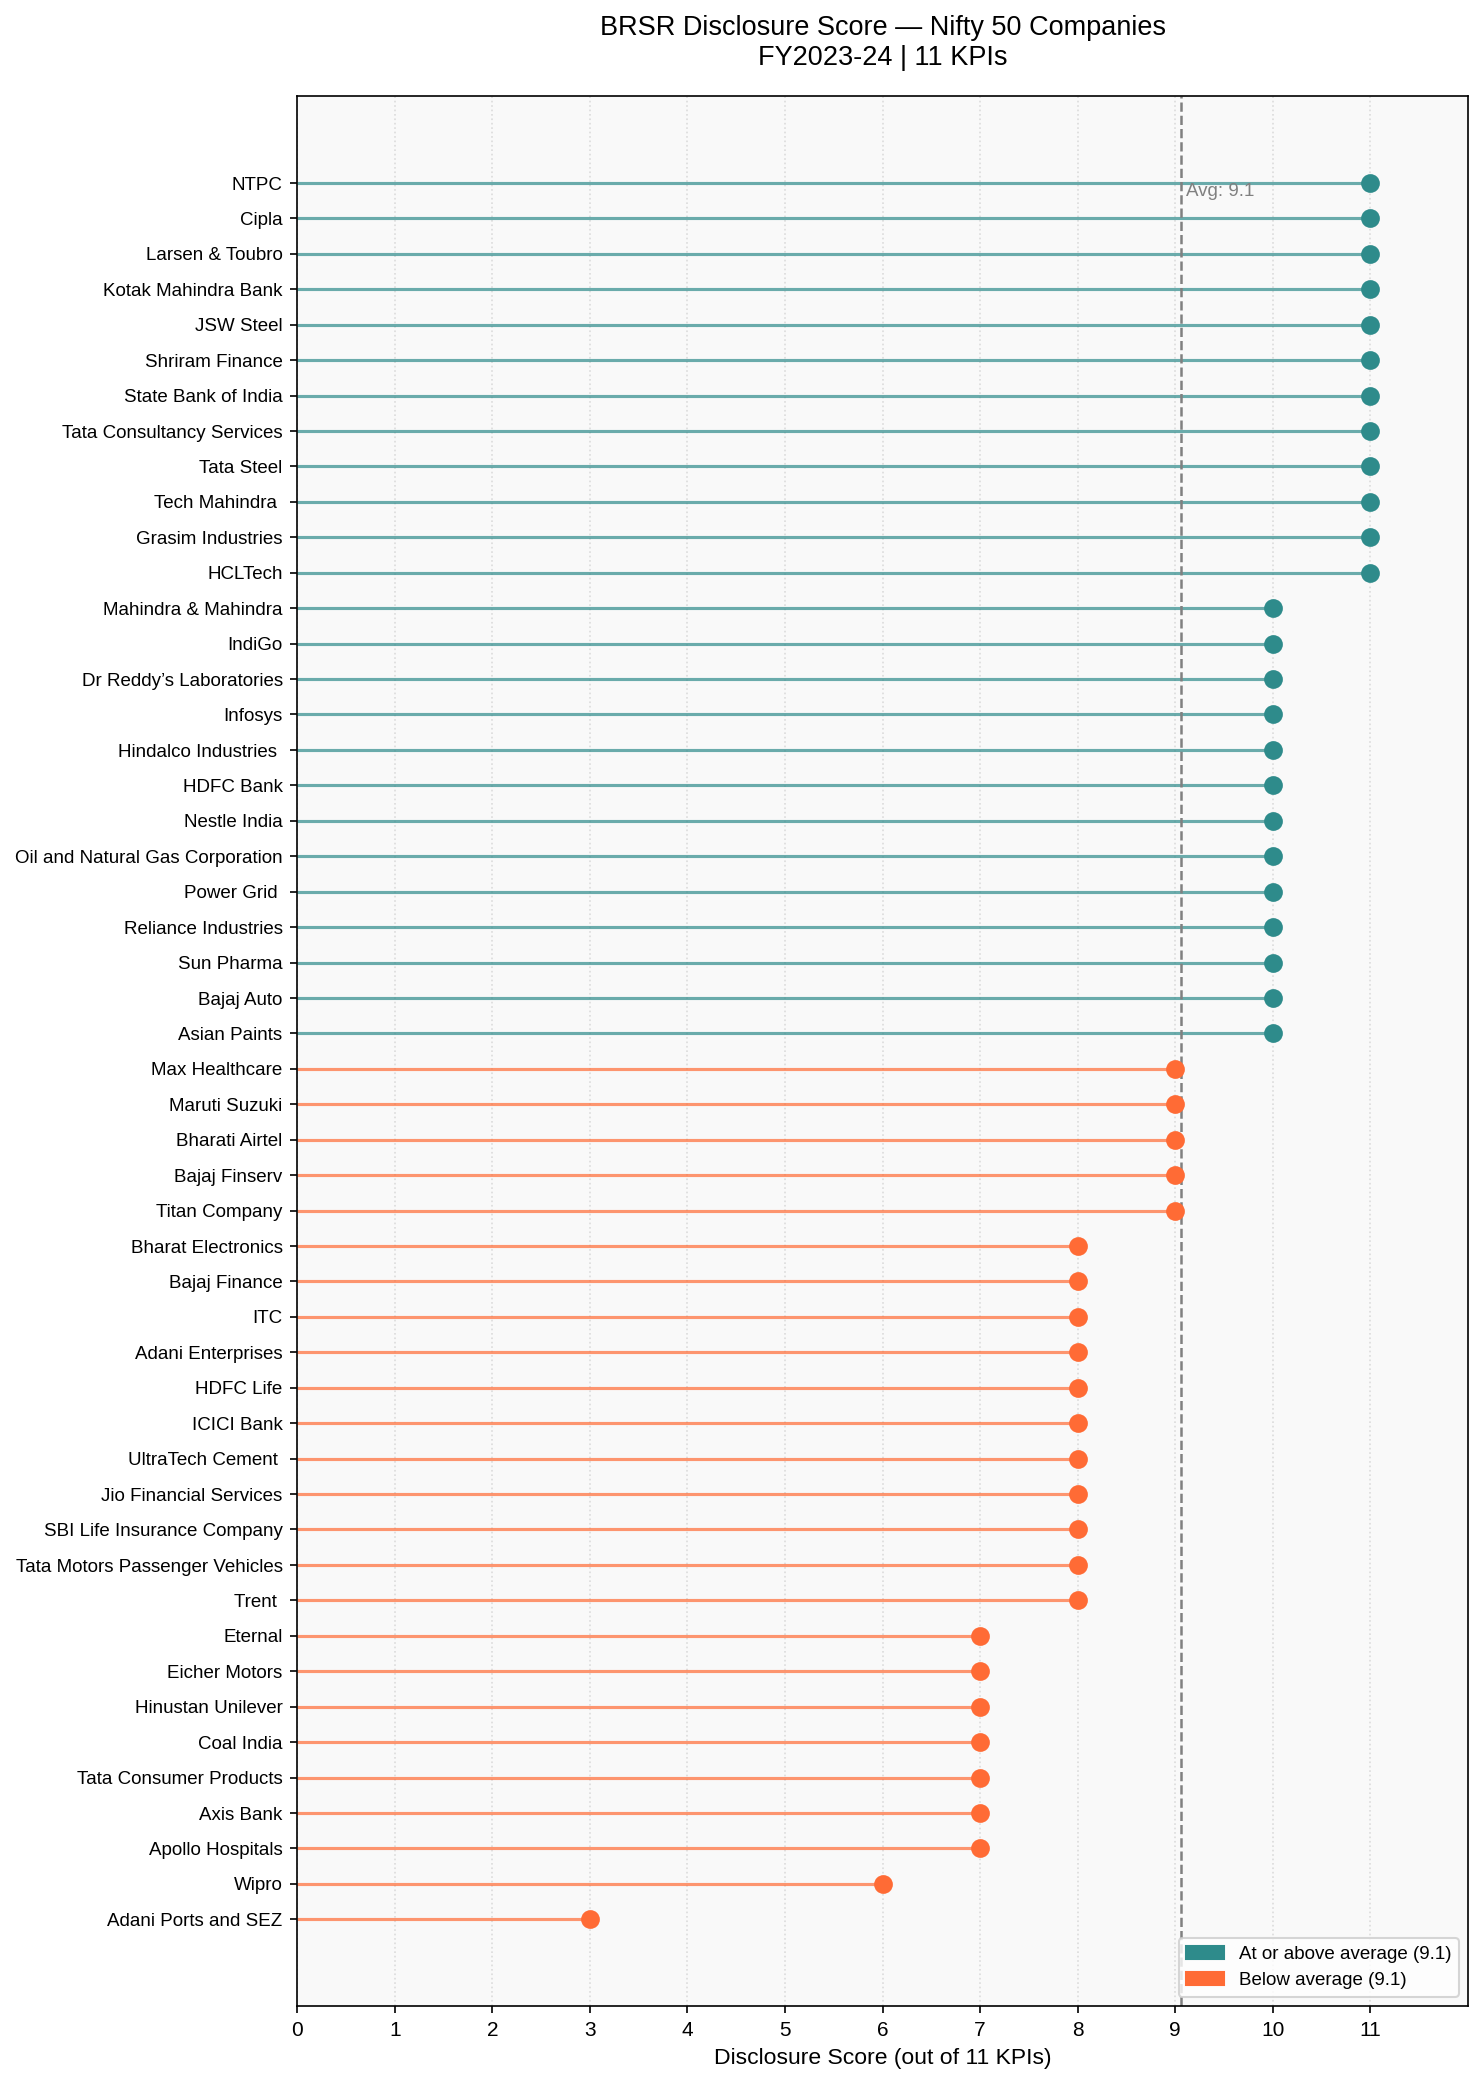
Figure 5 — BRSR Disclosure Score — lollipop chart ranking all 50 companies by total disclosure score out of 11 KPIs, split into “at or above average” (avg = 9.1) and “below average” groups. NTPC, Cipla, L&T, and Kotak Mahindra Bank top the list with near-perfect scores, while Adani Ports and SEZ (3/11) and Wipro (6/11) rank lowest, highlighting the weakest individual performers.
BRSR Disclosure Manipulation — Key Findings
Based on a review of all 50 Nifty companies’ BRSR disclosures, the gaps and manipulations fall into a few clear patterns. Below are the categories with examples.
1. Methodology / Formula Manipulation
Companies quietly change how a metric is calculated, which changes the reported figure in the company’s favour without technically lying.
- Dr Reddy’s — Account payable days should be calculated using total cost of goods/services procured, but they restricted it to only materials procurement.
- Eicher Motors — Account payable denominator excludes contract manpower services purchased, making the ratio look better than it is.
- Adani Enterprises — Waste intensity calculation was restricted to a subset of business instead of total company revenue, as revealed only in a footnote.
- Shriram Finance — Water discharge figure simply assumes 100% of water consumed equals water discharged, with no real measurement or boundary basis.
2. Geographic / Boundary Restriction
Companies narrow the physical scope of reporting (only certain offices, plants, or cities) instead of covering the whole organization.
- Eternal (Zomato) — Water discharge data covers only the Bangalore office; waste intensity is restricted to just three corporate offices (Gurugram, Kolkata, Bangalore).
- Infosys — General waste data is limited to India, Indianapolis, and Shanghai; e-waste is the only category reported globally.
- Wipro — Water discharge reported for just one location, despite being a large multi-site company.
- SBI Life Insurance — Waste intensity tracked for only two owned buildings; water discharge excludes all 1,038 rented branches.
- Hindustan Unilever — Water discharge reported only for owned manufacturing sites, leaving out leased facilities.
- Asian Paints — Around 53,000 KL of estimated discharge from leased offices was left out of the reported table.
3. Workforce / Definitional Exclusion
Companies redefine “employee” or “worker” narrowly to avoid reporting on contract staff, apprentices, or non-payroll workers.
- Bajaj Finance — Claims they don’t hire “service workers,” effectively excluding non-payroll personnel from the definition of worker entirely.
- Titan Company — Human rights training figures exclude contract workforce and non-permanent employees.
- Wipro — Gender wage gap and safety incident data consider only permanent Indian employees.
- ITC — Safety incident data excludes trainees/apprentices and offsite injuries, counting only onsite permanent staff accidents.
- Dr Reddy’s — Despite having full human rights training data, no training was ever given to non-permanent workers.
- Trent — Safety incident reporting considers only permanent employees.
4. Missing Data Left Unexplained
Fields are simply left blank, marked NIL/NA, or omitted, with no methodology or reason given — a transparency violation in itself.
- Adani Ports and SEZ — No explanation given for missing data on gender, accounts payable days, data breach, or job creation in small towns.
- Mahindra & Mahindra — Several safety-related columns left blank with no explanation.
- HDFC Life — Safety incidents marked NIL/NA with no clarification of methodology.
- Jio Financial Services — Waste intensity and water discharge simply marked “not applicable.”
- IndiGo — Scope 3 emissions marked NIL with no reasoning given.
5. No Third-Party Assessment / Assurance Gap
Data is reported, but without independent verification — undermining its credibility even when figures look complete.
- Bharat Electronics — No independent assessment conducted for water discharge or waste intensity.
- Coal India — Waste intensity and Scope 3 emissions both based on estimation, with no third-party assessment.
- ICICI Bank — Scope 3 emissions not assessed by any third party.
- SBI Life — Total Scope 3 emissions and intensity not third-party assessed.
- Tata Consumer Products — Waste intensity figures not independently assessed.
6. Data Reliability / Internal Inconsistency
Numbers reported don’t add up internally, or are based on rough approximation rather than actual measurement.
- Bharti Airtel — Waste generated does not match waste recycled/disposed figures; data is based on approximate weight, not actual measurement.
- Coal India — Claims water discharge data is “estimated” but provides no methodology behind the estimate.
7. Selective Category Exclusion (Boundary Omission within a Metric)
Specific sub-categories of waste or emissions are quietly dropped from the total, shrinking the reported figure.
- Coal India — Overburden waste (OB) excluded from total waste intensity calculation.
- Eicher Motors — Non-hazardous waste excluded from recovery and disposal tracking.
- Tata Motors Passenger Vehicles — Unspecified quantities of plastic waste and other non-hazardous waste excluded from totals.
- Hindalco Industries — Scope 3 emissions from waste only partially computed (fly ash and bauxite residue only, other sources ignored).
8. Evasive “Not Applicable” Declarations
Material disclosures are dismissed as “not applicable” without any supporting reason, despite being relevant metrics for the company.
- Maruti Suzuki — Social Impact Assessment (SIA) and Rehabilitation & Resettlement (R&R) both marked not applicable with zero explanation.
- Apollo Hospitals — Safety-related incidents marked not applicable.
Where Disclosure Was Done Well (For Contrast)
A few companies stood out for genuine transparency, which helps benchmark what “good” reporting looks like.
- HDFC Bank — Gave explicit methodology for how bonus provisions and final settlements were factored into the gender wage gap calculation.
- Power Grid — Detailed, complete figures for water discharge and waste intensity, including third-party contractor workers in safety data.
- Larsen & Toubro and Reliance Industries — Gave detailed, well-explained safety-related disclosures.
- Coal India — Despite gaps elsewhere, gave a full quantitative breakdown of human rights training, even for workers not directly employed (high transparency on this specific metric).
- Tata Consultancy Services — Gave detailed category-wise classification of total Scope 3 emissions.
Limitations of the Study
1. Manual classification introduces subjectivity
The Authentic vs. Evasive/Manipulated classification for each company-KPI cell was determined through manual reading and judgment rather than a standardized, quantitative scoring formula.
2. Binary classification oversimplifies a spectrum
The heatmap uses only two categories (teal/orange), but the underlying notes show real variation in severity from a missing footnote explanation to deliberate formula manipulation. Collapsing these into a single binary flag loses nuance about how serious each instance of evasion actually is.
3. Single financial year (FY 2023–24)
The analysis is based on one reporting year only. It does not capture whether a company’s disclosure quality is improving, worsening, or consistent over time.
4. Self-reported data as the only source
The entire study relies on companies’ own BRSR disclosures in their annual reports. There is no independent verification against ground-truth operational data, so the study can only assess internal consistency and stated methodology.
5. Limited to Nifty 50 companies
Findings reflect only the largest, most closely-watched listed companies in India. These firms are likely to have more mature ESG reporting functions than the broader universe of BRSR-filing companies, so results may not generalize to mid-cap or smaller listed firms.
6. Fixed set of 11 KPIs
The study evaluates only 11 selected indicators out of the many disclosures required under the full BRSR format.Companies that score well on these 11 KPIs could still have significant gaps elsewhere in their BRSR report that this study does not capture.
7. No materiality or sector weighting
Each KPI is treated with equal importance across all companies, even though some metrics are more material to certain sectors than others (e.g., water discharge matters more for manufacturing than for IT services). This may unfairly penalize or favor certain sectors in aggregate scores.
8. Inconsistent depth of footnote disclosure across companies
Some companies provide detailed footnotes explaining methodology and boundaries, which makes evasion easier to detect, while others report a bare figure without saying how it was calculated. As a result, companies that are open about their limitations may be flagged more often than companies whose reporting is equally restricted but gives no way to tell.
9. Potential human error in data extraction
Given the volume of text reviewed manually across 50 annual reports, occasional misreadings, omissions, or transcription errors in the underlying notes are possible despite efforts at careful review.